
Google Analytics and Google Spreadsheets: Create Your Own Dashboard
Have you ever wanted to generate your own custom Google Analytics' dashboard? Well with Google's Spreadsheet and the Google Analytics Add-On you can now create visual reports of your data and embed them onto a website or save the images for presentations.
Getting Started:
Select a new Google Sheet, and then add the Google Analytics Add-on from the Add-ons menu. You will be asked to integrate with your Google Analytics account, and then a sidebar will show on the right side of the spreadsheet. To generate a New Report, go to Add-Ons>Google Analtyics>Create New Report. It will look like the screenshot below:
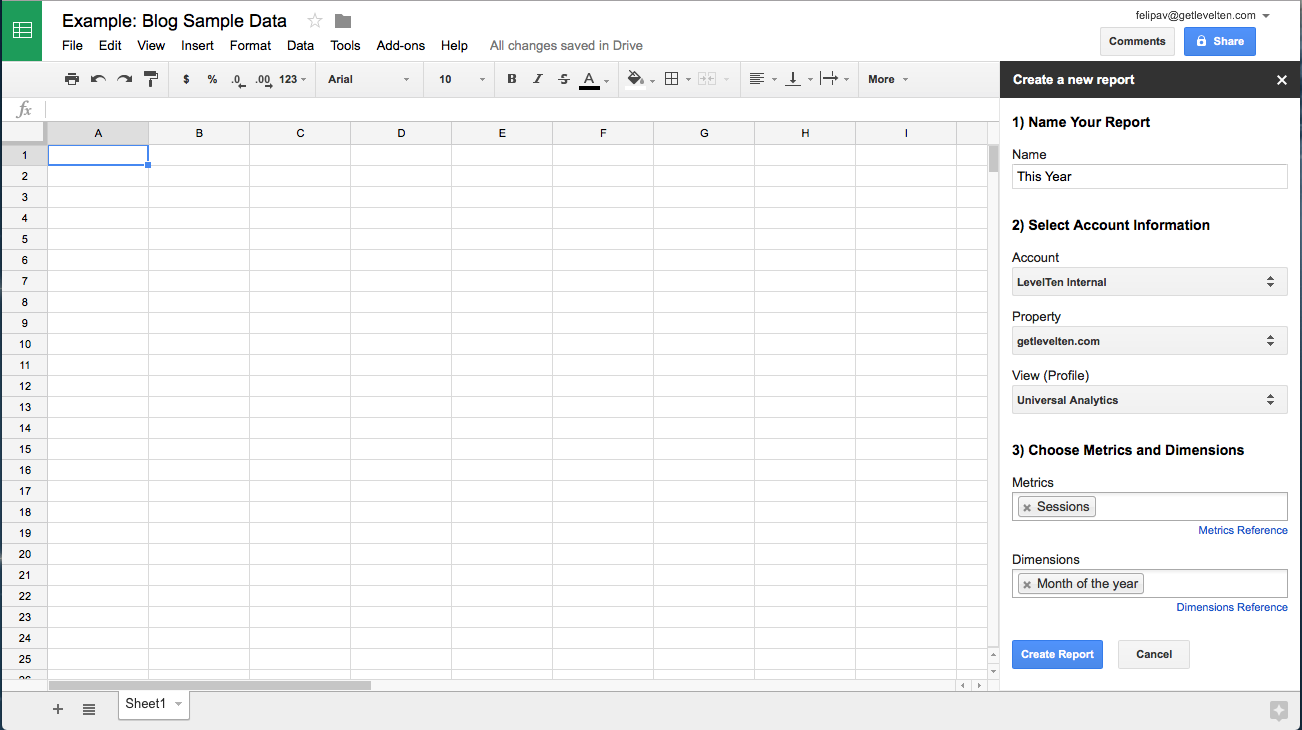
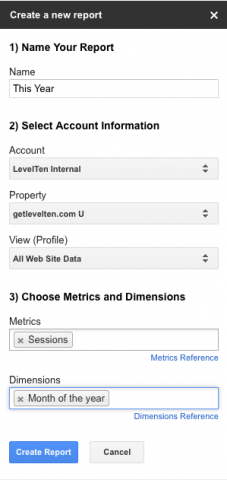
You will notice that on that on the right, you will Name Your Report, in this example, I will compare This Year vs. Last Year’s Session results in terms of months. You will then select Create Report button. Below is a closer look at the Create a New Report.
New Report Result
Once clicking on the Create Report, you will see a spreadsheet similar to the one displayed below. For security purposes, I blurred the company's GA Tracking Code. In this example, I'm generating a report for sessions per month. However, you can track most Google Analytics' Dimensions & Metrics you would like.
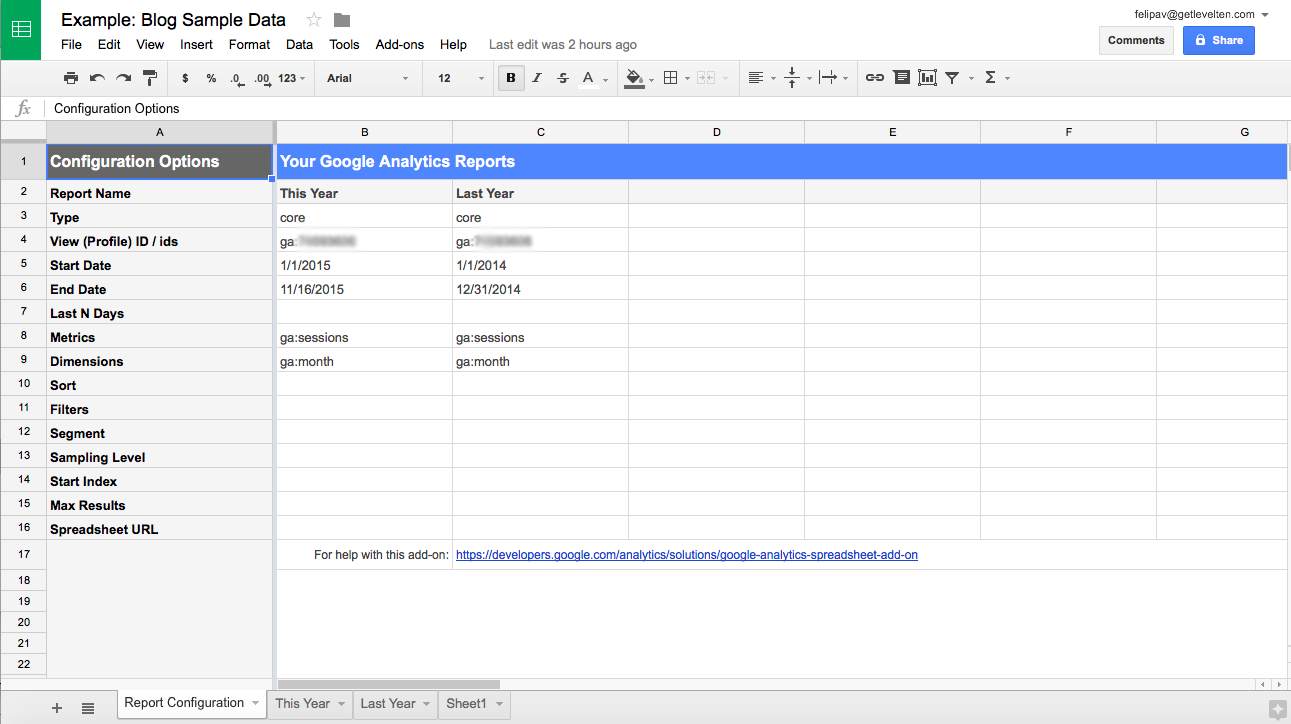
Examples would be sessions, bounces, Session Duration, Hits, Bounce Rate, Average Session Duration and others. In this case, when you see the metrics section, you will notice it will always start with ga: NameOfMetric. To learn more about the different dimensions and metrics, you do so by looking at Google's Analytics Core Reporting API Guides.
By default, the new report will have the field Last N Days for seven days, which in our case is not needed since we are doing a comparison for a large date range. Last N Date just means you can specify a value instead of an actual start and end date range. It's just preference, and I happen to find adding an actual date range easier. This brings me to setting a date range for your yearly comparison. For both Start Date and End Date, the format to use is YYYY-MM-DD or a relative date, such as today, yesterday, etc. To learn more about the configuration parameters, see the Google reference table.
As you can see from the spreadsheet above, I have already inserted the report for Last Year. This can easily be generated without having to run through the steps above. You just have to copy and paste the information in the column titled 'This Year' and paste it into the column to the right. Just remember to change the report name in column C row 2 and the time range to reflect the year before in Column C Row 5 and 6.
Run Reports
You are now ready to run the reports. Go to Add-Ons>Google Analytics>Run Reports like the menu below:
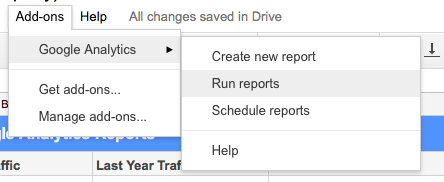
You will notice the Google Sheets will generate two additional sheets with data information for the whole year for the two separate report names. This information is what will generate your custom dashboard.
Creating Custom Dashboard
In the video, I go through the steps of generating the graph/dashboard from all the data that was generated in the step above.
The Result
And you could essentially save these dashboards and present them to your marketing team. This neat feature between Google Docs/Sheets and Google Analytics allows for easier visualization for individuals that really don't know how to read all the data given by Google. It takes a little work, but the result is worth it.
Of course, there is software out there that generate dashboards for you. LevelTen uses Open Enterprise Intelligence, a Google Analytics dashboard built into the website. In other words, when I need to view traffic, conversions, events, etc., Intelligence generates graphs that put the data Google Analytics gives into easy to read visual graphs. To learn more about this analytics software, watch the video below or learn more about it here.
What does your team currently use to present analytics results? What software? Do you find it hard to present the data? Let me know in the comments below!

